Building a Business Intelligence suite: revisiting an old idea after six years in the industry
The origins
Six years ago, I was working on my Master’s thesis. My machine was a display-less HP laptop with a remapped azerty layout running Xubuntu, connected to an external monitor, whose internet connection depended on how I placed the dangling Wi-Fi antennas.
It was after two years of studying for my Business Analysis and Enterprise Performance Controlling degree, during which I had some very valuable courses touching topics like Data Modelling or Business Intelligence. I’ve also had a little less than three years of work experience, two of which in a Data Analyst-like position that included basic SQL queries. At the same time, I was oblivious to many of the modern software engineering best practices and was not aware of what source control was.
The year was 2016 and I was looking to design and build an Enterprise Performance Management system for an imaginary retail clothing company. My goals were: to apply what I’ve been learning during my university courses, improve my Python, explore web development and use only open-source software in the process.
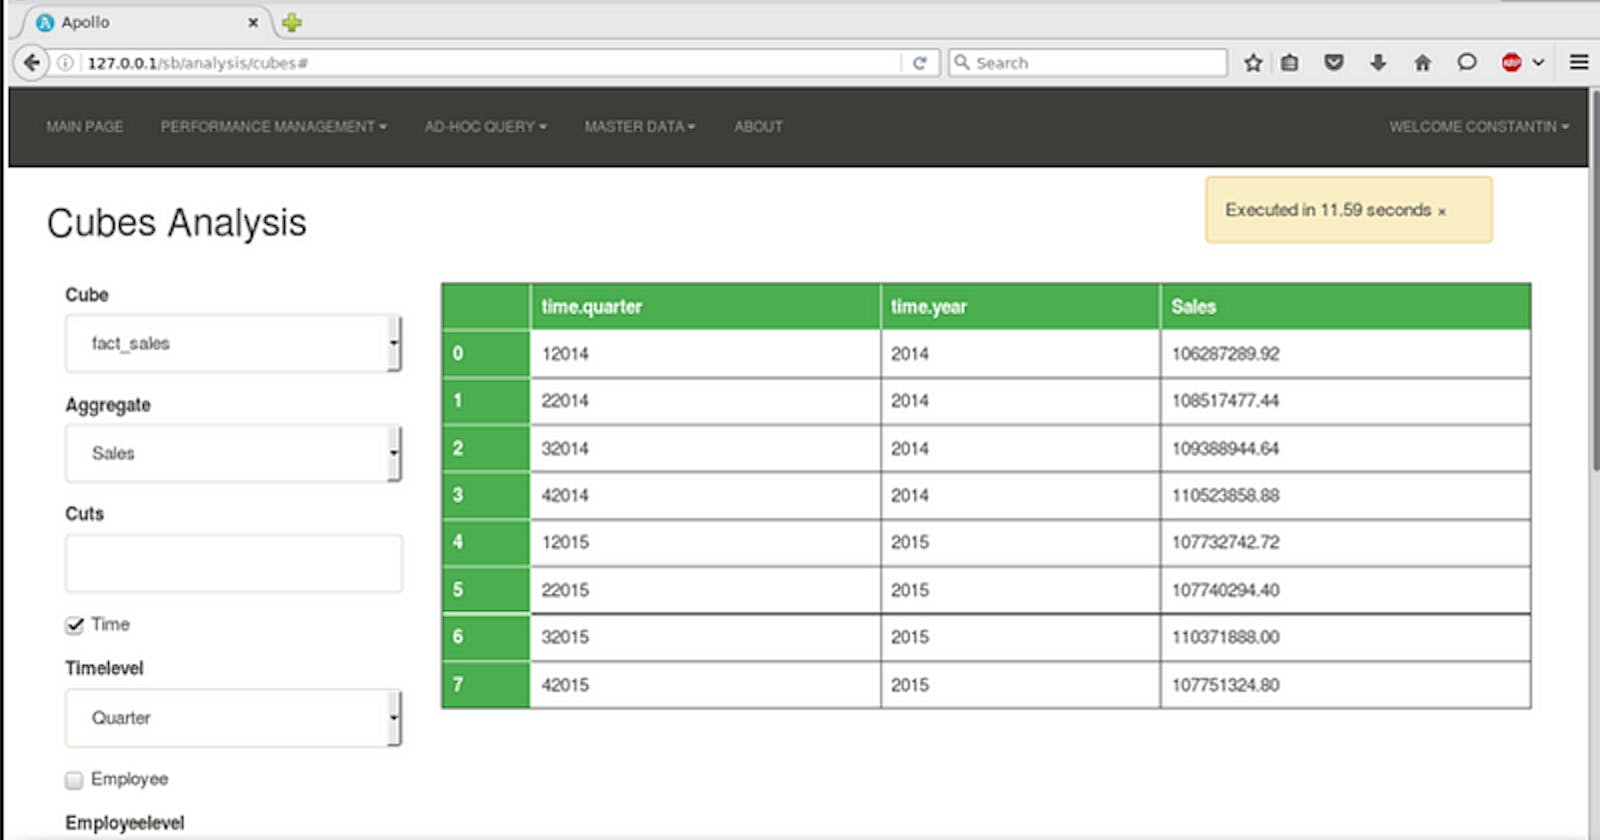
After a good six months of late-night coding and learning by doing, I came up with the following:

This marvel of engineering was built using Python 2 with Web2py as the web framework, MySQL using Infobright Community Edition engine as the Analytical Database, the Cubes Python framework to run OLAP queries and Pygal for charts and graphs. So what could one do with it?
You could select a store name to see sales charts.

It would compute the Profit & Loss Statement, including Planned (which was also entered in the portal) and Actual.

There was functionality to run ad-hoc OLAP queries.
All the above, of course, came up with a lot of explanatory notes not unlike the below, detailing why it is all that important.
It should go without saying that data is the key underpinning of any modern business.
Just like the blood irrigates the entire body, so does data flow throughout the organization, in various shapes, enabling both day-to-day activity as well as strategic decisions.
Every business person does some Business Intelligence (BI) work, even unknowingly so. Regardless of whether the calculations are done inside their head, on paper or in a spreadsheet, there is (or at least we hope) some train of thought behind business decisions.
The explosion of interest in data has been tightly tied to a broad specter of software solutions, at different price points, that cater to the analytical needs of an organization. Fortunately, we live in happy times where the choice is extensive and the barrier to getting started is quite low. This means that as a startup or a small company, we can start small and work our way up based on our needs.
So all in all, I was quite content with the result and I’ve felt I’ve learned a lot of things. I’ve also understood how valuable could learning by doing be.
I went on to work in the industry first as a Business Intelligence Developer, then as a Data Engineer. Six years flew away very fast, so here we are.
Our days
Nowadays the need described above hasn’t gone anywhere and, if anything, has intensified. What has changed though is my understanding of it and how would I build something similar today.
I was looking for a quick and fun project to showcase what I currently know (a portfolio of sorts), but also to fill in some gaps about things I didn’t do at the moment, like dbt. So there is another chance to build a Business Intelligence application again, after six years spent in the industry, to illustrate a use case close to real-life. It’s also great if in the process we can create something portable, and modular that also uses open-source tools.
If you’d like to inspect the code yourself, it’s available onGitHub.
This time, the imaginary Company that we’re going to help is a postcard manufacturer that prints and distributes postcards to a wide number of cities in Europe.
The Company sells the postcards both directly in their tourist shops as well as through distributors which are paid a commission for it.
The company needs a tool that will enable its employees to extract actionable insights from the information they already have. What are the best-selling formats, in what cities do people buy more postcards, and what formats and messages do people prefer — all of these are valid questions that the business needs answering.
Let’s now have a look at what data inputs the company have.
Problem definition: the data sources
The Company currently runs a transactional system that manages all the sales it makes directly. At the same time, the resellers supply CSV and XML files that cover the sales they have intermediated.
The OLTP database

The Company’s transactional database
The data is fictional and automatically generated. Any similarities with existing persons, entities, products or businesses are purely coincidental.

CSV data received from the resellers

XML data received from the resellers
The tools for the job
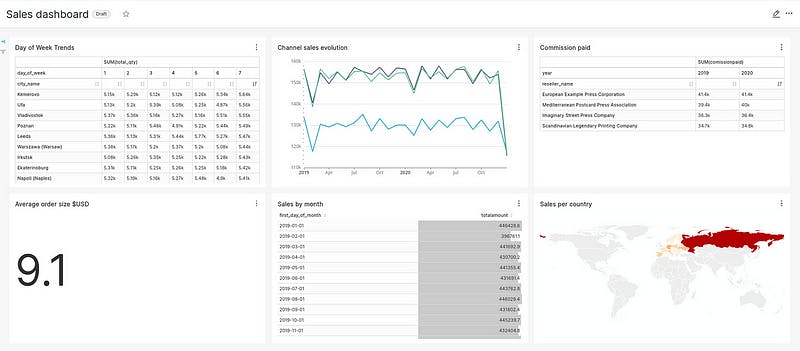
How does one tackle such a task nowadays? To get from the above to this:

we would need quite several tools to work together:
A database (simple yet powerful enough) to build our Data Warehouse in, like PostgreSQL
A data transformation and modeling tool, like dbt core
An orchestrator to coordinate ingestion and modeling processes together, like Airflow
A presentation and querying tool for the consumers of data, like Superset
A way to make it self-contained, modular and repeatable. Here’s where docker and docker-compose come into play.
Conclusion
In this post, we’ve briefly presented how I approached the idea of an open-source Business Intelligence solution as a graduate student in the far and distant 2016 and laid down the foundation for building a new, updated solution using tools common in the industry nowadays.
Stay tuned for the next post in this series (will post a link here once done) to see how we’ll bring all these tools to work together, discuss what’s changed since the last time we tried to do it and look into more avenues for improvement.
Thanks for reading!
Reminder: if you’d like to inspect the code yourself, it’s available on GitHub.
Found it useful? Subscribe to my Analytics newsletter at notjustsql.com.

